
Insights6 min read
From Manual Reporting to AI-Powered Analytics: How a Modern Analytics Application Works
Sajjak Ali
Every business generates data. The challenge is not collecting it — the real challenge is turning large amounts of raw records into information people can understand and use to make decisions.
Traditionally, companies depended on employees to do that work by hand: download data from different systems, clean Excel files, remove duplicates, combine information, calculate KPIs, create graphs, and prepare reports. It works while the data is small. With millions of records across multiple systems it becomes slow, repetitive, difficult to maintain, and more vulnerable to human error.
A modern analytics application automates the entire data journey — collecting from every source, storing the raw data, transforming and validating it, building analytical datasets, calculating metrics, visualizing the result, and using AI to help people interrogate it. This is how that pipeline is put together, and where AI does and does not belong in it.
- One Question, Six Systems
- A manager asks something simple — how is the business performing this month? — and the answer lives in an ERP, a CRM, an accounting system, a time tracker, a payroll system, an e-commerce platform and a folder of spreadsheets.
Each of those stores data differently. The ERP holds customers, suppliers, invoices and payments; the CRM holds companies, contacts, opportunities and activities; the time tracker holds employees, projects, hours and timesheets. They have their own identifiers, their own naming conventions and their own idea of what a date looks like. Answering one question means reconciling all of it first.
- What Manual Analytics Actually Costs
- Without an analytics application, one person does every step by hand — and does the same steps again next month.
- Collecting — log into each system in turn and export invoices, customers, employees, timesheets and payments as separate files.
- Cleaning — duplicate customers, missing values, incorrect dates, invalid amounts, different currencies and different date formats. ABC Ltd, ABC Limited, ABC LTD. and A.B.C Limited are one company, and at the moment only a human knows that.
- Combining — match customers to invoices to payments across sources, by hand, correctly.
- Calculating — total revenue, outstanding and overdue amounts, gross profit, revenue per customer, revenue by month and by region.
- Presenting — build the graphs, assemble the report, send it to management.
The problems compound. Employees spend their time preparing data rather than analysing it. A wrong formula, a missing row or an accidental deletion changes the answer with nothing to catch it. Thousands of records are difficult to process by hand and millions are practically impossible. And management receives the picture days after the activity it describes.
- The Automated Pipeline
- An analytics application replaces that sequence with a pipeline that runs whether anyone is watching or not.
Connect. The application talks to the source systems directly — REST and GraphQL APIs, database connections, cloud storage, files — so nobody logs in and downloads anything.
Ingest. Data is brought from those systems into the analytics environment on a schedule or continuously, still in roughly the shape the source sent it.
Store. A data lake holds it centrally — structured and unstructured alike — without forcing it into a reporting schema before anyone knows what will be asked of it.
Transform. ETL or ELT does what the employee used to: extract from the source, remove duplicates, validate values, standardize formats, join datasets, calculate derived fields, and load the result somewhere queryable.
Model. A semantic model turns those tables into business terms — revenue, overdue, customer — so that a chart and a question mean the same thing.
Serve. Dashboards and the AI layer both read that one model. On a Microsoft stack this is Data Factory pipelines into OneLake, transformation, a semantic model, and Power BI on top; the technologies vary and the sequence does not.
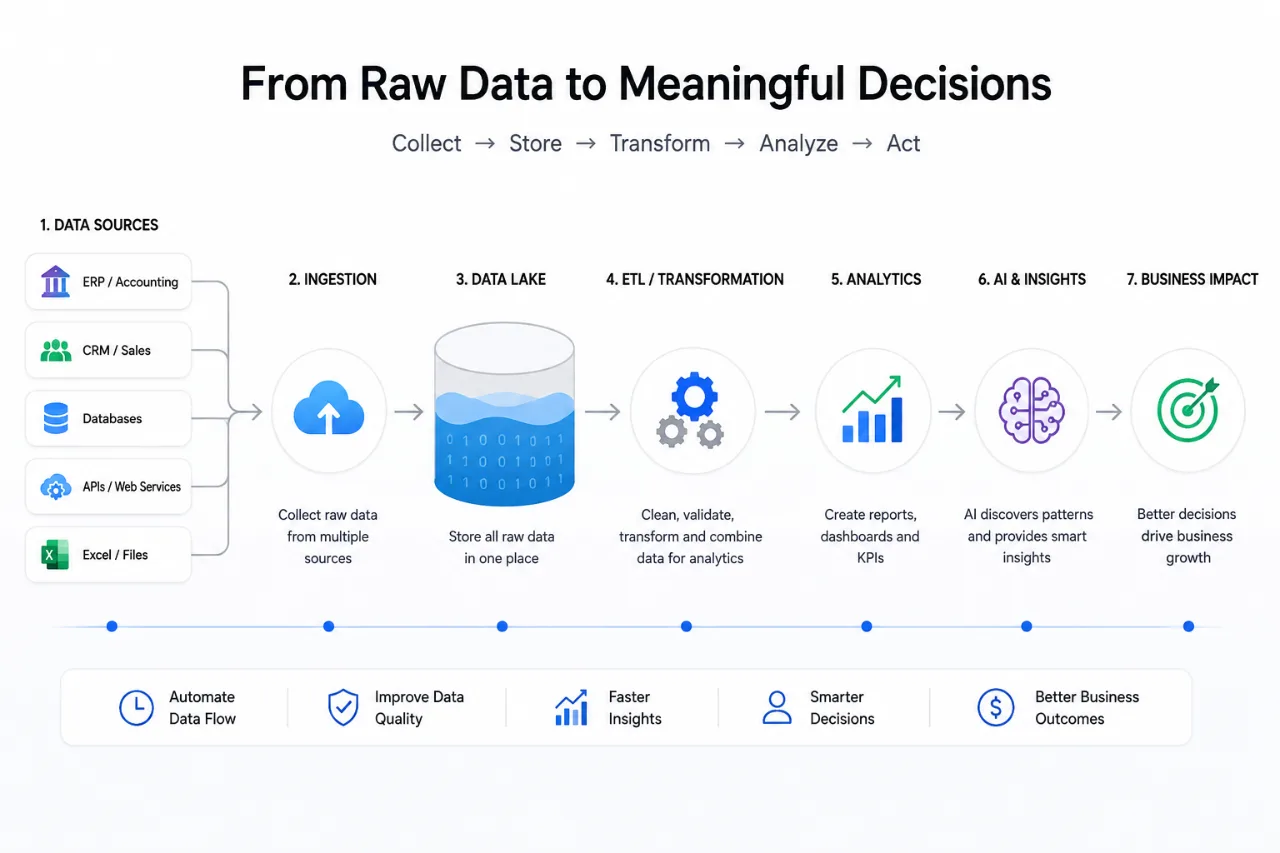
The same sequence, seen at once. The paragraphs above stop at Serve, because that is where the engineering ends; the drawing carries it two stages further, to the insight and the decision, which is the only reason any of it gets built. One invoice, before and after the pipeline Field As the ERP sends it After transformation InvoiceDate 16/08/2026 2026-08-16 Customer ABC LTD. CustomerId 10245 Amount the text "15000" the number 15000.00 Currency EUR EUR, validated against the master list - Bronze, Silver, Gold
- A useful way to read any modern data platform is as three layers of the same data.
- Bronze — the data close to what the source sent, kept unchanged so anything downstream can be rebuilt from it.
- Silver — cleaned and standardized — duplicates gone, formats consistent, records validated.
- Gold — business-ready tables, shaped for reporting and analytics.
The names are a common convention rather than a product, and implementations differ. The separation is the part that matters: keeping the original means a mistake in a transformation is a re-run rather than a loss.
- What Changes at a Million Records a Day
- Ten thousand records a day is a spreadsheet. A million a day, ten million a month, a hundred million a year is not, and no amount of care makes it one.
A data platform absorbs that by distributing storage and computation, not by doing the same job faster. This is also where the most common misconception about AI in analytics shows up: the application is not asking a model to read a hundred million rows the way a person would. The platform does the storage and the arithmetic; AI operates on summaries, models, metadata, semantic information or selected datasets.
- Where AI Belongs — and Where It Does Not
- Traditional analytics answers what happened. AI helps with the questions that follow it: why did revenue decrease this month, which customers have the largest outstanding balances, which region is growing fastest, what changed since last month, what looks unusual.
The tempting architecture — raw data straight into a language model, everything analysed automatically — is not how a production system should work. The data platform provides reliable, structured information; AI provides a more natural way to interact with it. It is a layer on top of trusted data, not a replacement for producing it.
Natural-language questions. Show revenue for the last six months, instead of six filter selections on a dashboard.
Automated summaries. Revenue increased by 12% compared with the previous month, while outstanding invoices increased by 8%.
Anomaly detection. Invoices normally run between €1,000 and €10,000; one for €250,000 is surfaced rather than found later.
Explanation. Not only that revenue fell 14%, but the contributing factors the available data actually supports.
It is worth separating automation from AI as well. Fetching ERP data at two in the morning, transforming it and refreshing a dashboard is automation, and a great deal of the value in an analytics platform sits there with no model involved. AI adds an interface to it.
- Manual Against Automated
The same work, done two ways Area Manual process Analytics application Data collection Employee downloads data Automated ingestion Data cleaning Manual Excel work ETL and ELT pipelines Storage Local files Data lake or lakehouse KPI calculation Repeated by hand each cycle Automated Reporting Report prepared each cycle Dashboards refresh themselves Large datasets Difficult, then impossible Designed for the volume Error risk Higher Automated validation Decision making Delayed Scheduled or near real-time
In closing
The evolution of analytics is a journey from manual data processing to automated, scalable, AI-assisted decision making: multiple sources, ingestion, a lake, ETL, clean data, a business model, analytics, dashboards, AI, insight, decision, action.
The most important idea is that AI is only one part of that architecture. Reliable analytics begins with reliable data — collected, stored, cleaned, transformed, modelled and validated. Once that foundation exists, dashboards, graphs, machine learning and AI can turn it into something useful.
The goal of an analytics application is therefore not simply to display data. It is to create a complete path from raw data to trusted information, to insight, to decision, to business action.